From Niche to Necessity: The Evolution of Business Intelligence Platforms
Business Intelligence (BI) platform offerings are no longer a niche set of database management tools requiring deep, technical skills. The field has expanded into a competitive marketplace of solutions – businesses now self-select for their specific needs.
The result of this healthy competition? Access to data and BI tools is no longer a luxury – it’s an expectation. This has elevated data’s role in strategic planning. For healthcare providers, data allows them insight into optimizing care delivery, enhancing patient experiences, and projecting trends to ensure financial health. Visualizing vast amounts of data is now incredibly accessible, making critical information readily available for informed decision-making.
Instead of holding access to data hostage, Nymbl Systems puts your data to work for you. At Nymbl, our BI offerings to customers fall into two categories: “canned” dashboards and customizable, ad-hoc analysis dashboards.
Canned dashboards are developed by our business analysts with DME, O&P, and CRT industry experience to deliver quick insights. These dashboards are aligned with standardized KPIs and are ideal for immediate
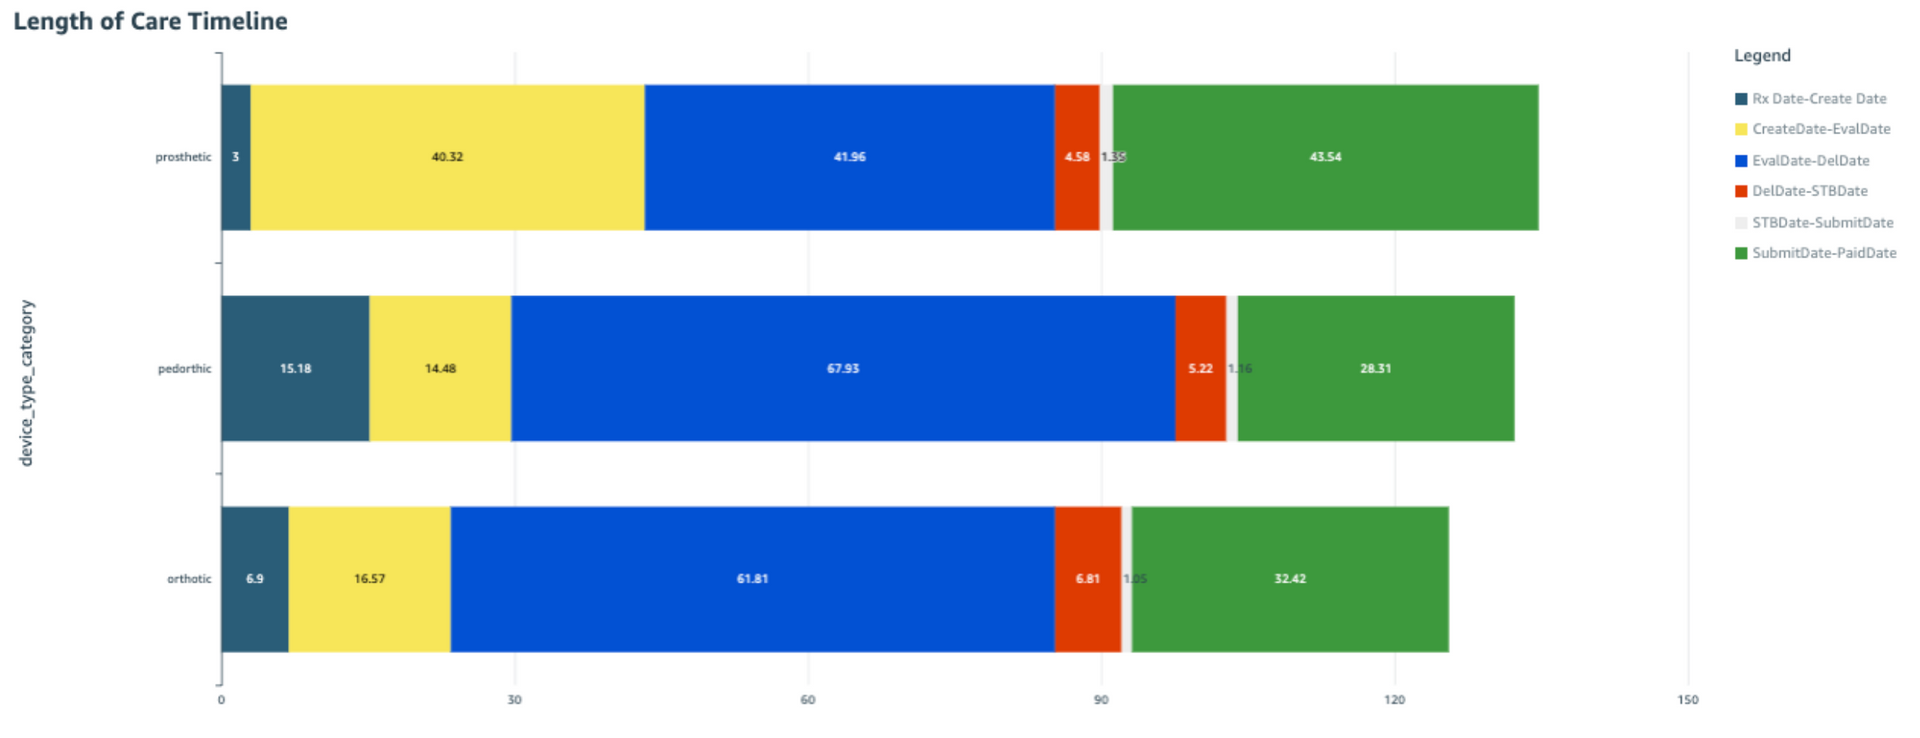
access to performance metrics and trends. One of our customers’ favorite reports is the Length of Care Timeline. This visualizes the lifecycle of orders from initial prescription through first payment. Within the dashboard, a user can drill down into metrics for specific practitioners, clerical users, and branches.
Need something more custom? Nymbl users benefit from ultimate flexibility and freedom with ad-hoc analysis access. Owners and practitioners can build out reports and publish dashboards for specific organizational needs. This customization feature is particularly valuable for addressing more complex issues that require nuanced analysis. If that sounds pretty intense, don’t forget that Nymbl’s BI dashboard builder caters to a range of skillsets. While having an analyst is crucial to ensure data literacy and correct implementation, a data-savvy business user has minimal learning curve when interacting with the visual-building tools in Nymbl dashboards.
While we’re excited about these dashboards, we’re not finished making business insights intuitive and easy to access. Nymbl is in the early phases of exploring benchmarking, which would enable healthcare organizations to measure their performance against industry standards or peer institutions. Benchmarking can cover various aspects of healthcare management, including patient satisfaction rates, treatment outcomes, and operational efficiency. In practice, benchmarking is invaluable in recognizing best practices, identifying areas that need improvement, and maintaining competitive standing.
The use of business intelligence tools in healthcare goes beyond simple data access; it transforms data into a strategic asset that empowers organizations to achieve operational excellence and superior patient care. So, if you’re ready to dive into all that Nymbl Drill-Down Dashboards have to offer, we want to have a conversation!